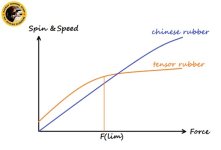
Graph comparing speed (output) vs input of different rubber types

This user has no status.
Member
Mar 2024
59
71
303
1712085514699.png

Edit: 2-4-'24: adding the latest graph here so that this is the thumbnail instead of the ERT pic below. For the latest graphs, see the latest posts.

Hi all, as a beginner I'm trying to make sense of the different rubber types.
  • ESN rubbers are non-linear, Chinese rubbers are typically more linear.
  • Soft sponges activate at lower stroke speeds, but they top out earlier when you hit through them.
There's a graph online (from EmRatTich/Pingsunday) that compares the ESN vs the Linear rubbers:
p1.png

This graph is helpful in udnerstanding. However I wanted to add rubber hardness to the graph, to better understand the larger picture. With some messing around in Excel I came to the following:

Image removed. See latest version in my last post.

Without taking into account rubber thickness and type of stroke (flat vs super loopy), would this be generally correct?
 
Last edited:
This user has no status.
Well-Known Member
Aug 2016
2,597
1,792
4,616
Read 3 reviews
Hi all, as a beginner I'm trying to make sense of the different rubber types.
  • ESN rubbers are non-linear, Chinese rubbers are typically more linear.
  • Soft sponges activate at lower stroke speeds, but they top out earlier when you hit through them.
There's a graph online (from EmRatTich/Pingsunday) that compares the ESN vs the Linear rubbers:
p1.png

This graph is helpful in udnerstanding. However I wanted to add rubber hardness to the graph, to better understand the larger picture. With some messing around in Excel I came to the following:

View attachment 28782

Without taking into account rubber thickness and type of stroke (flat vs super loopy), would this be generally correct?
I use 40 degree old H3 (tacky) on my BH. The curve goes a bit exponential actually. It will take me quite a bit of effort to get enough speed (which I prefer). E.g. I put in 5 effort = power 3, 6 effort = power 3.5 but when I give 8 effort = power 9

Newer H3 (non tacky) is a lot more linear
 
  • Like
Reactions: Johnniedarko
This user has no status.
Member
Mar 2024
59
71
303
Thanks for your feedback. That makes sense, hard rubbers don't get activated until a certain point. I added an exponential curve for the old H3, close to your values.
I lowered the top speed of all other rubbers so that the max speed of old H3 is slightly above Linear Hard (New H3).

Image removed, see latest version in my last post.
 
Last edited:
  • Haha
Reactions: longle
This user has no status.
Well-Known Member
Oct 2014
12,665
18,276
45,785
Read 17 reviews
Thanks for your feedback. That makes sense, hard rubbers don't get activated until a certain point. I added an exponential curve for the old H3, close to your values.
I lowered the top speed of all other rubbers so that the max speed of old H3 is slightly above Linear Hard (New H3).

View attachment 28784
For people serious about looking at the reality of things, substituting logic for data is a bad idea. However, if we do have the data, finding a good story to explain it is a good idea. So you have skipped a step.
 
This user has no status.
Member
Mar 2024
59
71
303
Hi all. Thanks for responding, even if you aren't a fan of the graph. I have learnt so much from reading your posts on this forum, going back years.

The goal of this graph is not to provide a factual representation, I hope I make that clear. Perhaps I shouldn't have added H3 old by name, that line was just meant for a general exponential type rubber.

So what is my idea?
The internet is full of words describing rubbers, not based on data points either ('slow', 'activates', 'springy', 'bottoms out'). My idea is to have a graph to visualise those words somewhat more. Have a few curves in there that roughly describe the most common rubbers, so that communication becomes easier.
Perfection isn't necessary, it's to give a general gist.

As an example: if someone plays with a very soft tensor rubber and asks for a 'upgrade', you could help that person by pointing out that it has a limited max speed, and point to better alternatives. A picture says more than a 1000 words.

With actual data it could possibly be an actual graph, but as mentioned, many variables would need to be fixed, stroke type and blade being big ones. Not to mention that it is for only one relevant dimension, but doesn't say anything about another inportant parameter: spin, which is also nonlinear in many ways. So a lot of work for a not so big reward.

Just to point out, I am a mechanical engineer as well. I have studied car and motorcycle tires and I am reasonably familiar with the nonlinear behaviors of at least those rubber surfaces, plus tire construction which has little to do with rubber. It seems very comparable to the table tennis rubber+blade combo.

I was debating of making a physical model of tt rubbers + blades out of hobby (I like modelling stuff), and this is for me a part of the preparation. Its good to have a better general understanding before starting research. So this was for myself but I figured it might be useful for the community as well. I know at least Blahness has once mentioned the nonlinearity in different directions, and this was a hot topic on this forum once (yes, I really have read a lot...). But other than that I couldn't really find much on the subject. Some scientific papers that were good.

I like solving hard nonlinear puzzles. But even though I do have in theory enough to go on, high fps camera, access to a ball robot, and some good analysis tools, but I think the complexity here is incredibly large. Also I contacted some people who actually do have large amounts of data on blades, wether they'd be interested in cooperating for such a model, and they weren't. So it stays an idea for now.

So in short, if you think the visual is helpful, but could be better, then I'd love to hear your input and I'll edit it to make it better. If you all think it isn't helpful or even detrimental, I'll keep it to myself, no problem.
 
Last edited:
  • Like
Reactions: rbtitco
This user has no status.
Well-Known Member
Oct 2022
3,471
1,770
5,413
Hi all, as a beginner I'm trying to make sense of the different rubber types.
  • ESN rubbers are non-linear, Chinese rubbers are typically more linear.
  • Soft sponges activate at lower stroke speeds, but they top out earlier when you hit through them.
There's a graph online (from EmRatTich/Pingsunday) that compares the ESN vs the Linear rubbers:
p1.png

This graph is helpful in udnerstanding. However I wanted to add rubber hardness to the graph, to better understand the larger picture. With some messing around in Excel I came to the following:

View attachment 28782

Without taking into account rubber thickness and type of stroke (flat vs super loopy), would this be generally correct?
I think in theory the graph is correct, but its a bit exaggerated. I don't really think Chinese Hard rubber is much or any faster than Tensor rubber.

I think the spin ratio and spin potential is higher, and I think the variety of shot selection is wider, and I think the feeling of control and confidence is higher. To me, that's really where the benefit lies.

Hitting faster isn't the true goal, IMO.
 
  • Like
Reactions: Johnniedarko
This user has no status.
Well-Known Member
Oct 2014
12,665
18,276
45,785
Read 17 reviews
Hi all. Thanks for responding, even if you aren't a fan of the graph. I have learnt so much from reading your posts on this forum, going back years.

The goal of this graph is not to provide a factual representation, I hope I make that clear. Perhaps I shouldn't have added H3 old by name, that line was just meant for a general exponential type rubber.

So what is my idea?
The internet is full of words describing rubbers, not based on data points either ('slow', 'activates', 'springy', 'bottoms out'). My idea is to have a graph to visualise those words somewhat more. Have a few curves in there that roughly describe the most common rubbers, so that communication becomes easier.
Perfection isn't necessary, it's to give a general gist.

As an example: if someone plays with a very soft tensor rubber and asks for a 'upgrade', you could help that person by pointing out that it has a limited max speed, and point to better alternatives. A picture says more than a 1000 words.

With actual data it could possibly be an actual graph, but as mentioned, many variables would need to be fixed, stroke type and blade being big ones. Not to mention that it is for only one relevant dimension, but doesn't say anything about another inportant parameter: spin, which is also nonlinear in many ways. So a lot of work for a not so big reward.

Just to point out, I am a mechanical engineer as well. I have studied car and motorcycle tires and I am reasonably familiar with the nonlinear behaviors of at least those rubber surfaces, plus tire construction which has little to do with rubber. It seems very comparable to the table tennis rubber+blade combo.

I was debating of making a physical model of tt rubbers + blades out of hobby (I like modelling stuff), and this is for me a part of the preparation. Its good to have a better general understanding before starting research. So this was for myself but I figured it might be useful for the community as well. I know at least Blahness has once mentioned the nonlinearity in different directions, and this was a hot topic on this forum once (yes, I really have read a lot...). But other than that I couldn't really find much on the subject. Some scientific papers that were good.

I like solving hard nonlinear puzzles. But even though I do have in theory enough to go on, high fps camera, access to a ball robot, and some good analysis tools, but I think the complexity here is incredibly large. Also I contacted some people who actually do have large amounts of data on blades, wether they'd be interested in cooperating for such a model, and they weren't. So it stays an idea for now.

So in short, if you think the visual is helpful, but could be better, then I'd love to hear your input. If you all think it isn't helpful or even detrimental, I'll keep it to myself, no problem.
Alright - I think without putting tackiness (which is possibly what you mean by Chinese) on the chart, it is hard to understand and hybrid rubbers are the bulk of ESN rubbers nowadays at the professional level on the forehand. Tackiness helps a rubber play with more touch in the short game, and allows you to use a faster blade and still keep the ball short. And whether it plays more powerfully in the long game depends on sponge hardness.
 
  • Like
Reactions: Johnniedarko
This user has no status.
Well-Known Member
Jul 2017
1,772
856
2,947
Perfection isn't necessary, it's to give a general gist.
I agree but the data must be better than what you presented. There is no indication of how that data was obtained or if it was just made up.
I was debating of making a physical model of tt rubbers + blades out of hobby (I like modelling stuff), and this is for me a part of the preparation. Its good to have a better general understanding before starting research. So this was for myself but I figured it might be useful for the community as well. I know at least Blahness has once mentioned the nonlinearity in different directions, and this was a hot topic on this forum once (yes, I really have read a lot...). But other than that I couldn't really find much on the subject. Some scientific papers that were good.
Are you familiar with the term system identification?
This is what I did when working and I am still trying new things.

I like solving hard nonlinear puzzles.
Start with the spring constant not being linear as a function of impact speed.

But even though I do have in theory enough to go on, high fps camera, access to a ball robot, and some good analysis tools, but I think the complexity here is incredibly large. Also I contacted some people who actually do have large amounts of data on blades, wether they'd be interested in cooperating for such a model, and they weren't. So it stays an idea for now.
I can help if you supply the data. Gather data is the most time-consuming part. I know how to do the math. Do you know python?

So in short, if you think the visual is helpful, but could be better, then I'd love to hear your input and I'll edit it to make it better. If you all think it isn't helpful or even detrimental, I'll keep it to myself, no problem.
Don't bother to edit doubtful data. If you really have the equipment, you suggest then gather your own so you can trust it.
 
This user has no status.
Well-Known Member
Jul 2017
1,772
856
2,947
ERT/Pingsunday should of filmed himself demonstrating each of the data that is on that graph.
otherwise, it is no different than any other of his data that he shows - no substance. A mere ctrl c + v only.
I really don't think ERT had the expertise to do a scientific evaluation of rubber

Johnniedarko's graph is clearly false. The units on the x axis is stroke force. Then it says that 10=maximum power. The units are not consistent. If you look at where x=4 you can see some rubbers result in twice the ball speed with the same force. This doesn't make sense. The ball speed would be proportional to the impulse which is the integral of force over the contact time.
 
This user has no status.
Member
Mar 2024
59
71
303
Alright. Let's try again. Firstly, I made clear that there's no underlying data, right under the title.


I removed medium, as soft and hard give enough info, being the extremes.
I added Tacky (purple), using my limited Rakza Z EH experience and NextLevels post. In general terms, it is slower on fast hits, but behaves more as a grippy tensor on harder hits.

Graph removed, latest version is in the latest post.

@brokenball

I agree but the data must be better than what you presented. There is no indication of how that data was obtained or if it was just made up.
Agreed. It is all made up and I made that clear now. I'll remove the previous graphs.

Are you familiar with the term system identification?
I am, to be more precise I'm a production systems engineer. :)

Start with the spring constant not being linear as a function of impact speed.
That means the rubber behaves as a non-newtonian fluid? Possible but I wanted to start at the simpler idea that the spring constant is not linear as a function of deflection, such as in these type of progressive springs:
iu

And that's a seperate progressive spring rate for all 3 axis.

As far as data collection and analysis, I'll get back to you on that. I have to get out the door to a family event.
 
Last edited:
This user has no status.
Member
Mar 2024
59
71
303
I really don't think ERT had the expertise to do a scientific evaluation of rubber

Johnniedarko's graph is clearly false. The units on the x axis is stroke force. Then it says that 10=maximum power. The units are not consistent. If you look at where x=4 you can see some rubbers result in twice the ball speed with the same force. This doesn't make sense. The ball speed would be proportional to the impulse which is the integral of force over the contact time.

You are right about the units being inconsistent. I shouldn't have included units in the first place anyways. The better x-axis description is "left = small impact, right = large impact".

However, having a rubber with twice the ball speed at a the same impact seems very possible, I don't know what the issue with that is? Do you think the difference is too large? Do you have data for that? ;)
 
This user has no status.
Well-Known Member
Jul 2017
1,772
856
2,947
That means the rubber behaves as a non-newtonian fluid? Possible but I wanted to start at the simpler idea that the spring constant is not linear as a function of deflection, such as in these type of progressive springs:
iu

And that's a seperate progressive spring rate for all 3 axis.

As far as data collection and analysis, I'll get back to you on that. I have to get out the door to a family event.
A linear spring is F(x) = K*Δx
Here the force increases linearly with compression
A non-linear spring is something like F(x)=K*Δx^1.1
The force increase at a more rapid rate as the spring is compressed.
It looks like you are showing non-linear springs.
Non-linear springs are used in car shocks.
I did a test where I was compressing a TT ball and measuring the force as a function of compression.
Here is a graph compressing a TT ball. The red line is the position. The black line is the compression force.
We were compressing the ball slowly. The resolution of the feed back is 1 micron. The force is noisy. I was using pressure sensors. It would be better to use a load cell.
This was a crude test but I haven't seen anything better yet. I am sure there is some difference between an impact and squeezing.
I have access to a high speed camera too but I am retired now. It is up to someone else to do this.
BTW, many on the forum talk as if they know what happens at impact. No one knows the impact force of a ball at difference speeds like 10 m/s, 20m/s or 30 m/s. A 20 m/s ball always has the same translational energy. What is different is how fast the ball stops after hitting the paddle. It amazes me that people talk about hard rubbers being better but then the contact or dwell time gets shorter.
 
  • Like
Reactions: Johnniedarko
This user has no status.
Member
Mar 2024
59
71
303
Thanks for sharing, that's incredibly cool! The force curve (black line) does look like non-linear spring behavior (as you said F(x)=K*Δx^1.1). Seems to me that this behavior, coupled with a damping factor (spring-damper system) would describe tabletennis rubber great. If I understand correctly you say that this function is not correct for tt rubber?

And with regards to system identification; on the one hand it is fun to make a physical model (3d spring-damper systems of rubber, sponge and wood), but I've been dabbling in AI and training networks and making a black box based on photo's would be nice too.

To come back to your earlier question, yes I have python, though at this point I think I am still firmly in the paper blocnote phase :p

Just to emphasize to anyone reading this, in this post I'm brainstorming on how to build a model that represents the behavior of rubber. Which seems like fun. But the main reason I posted this thread is to have an illustrative picture to make it easier to explain and understand how different rubbers on the market relate to each other. Purely based on my speculation, not with any technical research to support it.
 
This user has no status.
Member
Mar 2024
59
71
303
I am not sure for the rest but
0 force should equal to 0 speed for any type of rubber, unless you have jedi powers.

Jedi powers are for sale on TT11, but I've adjusted the graph for those without.

I think in theory the graph is correct, but its a bit exaggerated. I don't really think Chinese Hard rubber is much or any faster than Tensor rubber.
Made the differences smaller, and gave them equal top speed.

Further changes in labels and axis'. Added illustratory examples of the type of rubber described.
1710711694316.png
 
This user has no status.
Well-Known Member
Jul 2017
1,772
856
2,947
Would you guys stop with the fake data? Do it right or not at all.
The x scale of low impact to high impact is meaningless. What are the units?
When the ball first hits the rubber, the force is zero, but it increases as the ball imbeds itself into the rubber. The above graph doesn't reflect that.
Also, it ignores the coefficient of restitution. There is a speed after impact formula.
The Tiefenbacher document shows the speed after impact changes with impact speed. In other words the coefficient of restitution drops as the speed of impact increases.
Tiefenbacher had some interesting observations about tacky rubbers.
I must have posted a link to this document 50+ times over the years.
The high-speed cameras and other sensors are MUCH superior to what Tiefenbacher had to use.

@Johnniedarko, you are headed for a lot of frustration. Most TT players are totally ignorant of physics and prefer to believe in myths. I posted the video of the TT ball compressing about 3 months ago. No one seemed to care.
Years ago PathfinderPro did some testing of rubbers and TT balls. No one remembers. You can find his YouTube channel.

If you want to know how to do it right, then pm me.

Just play.
 
  • Like
Reactions: Johnniedarko
says Fair Play first
Well-Known Member
Jan 2012
1,316
431
1,815
Could you give a clear-cut definition of tensor rubber.? None of you can, I surmise.
Yes, the afore mentioned graph is giving rather a correct understanding of tensor's specific character vs conventional rubber materials. Yet, a minor correction to the graph is still needed.

REMINDER TO ALL.
Truth to say, all the High-Resilience rubber materials (commonly known as "tensor") will give you troubles a lot, unless you really need some crazy horse of a rubber. This is to say that tensor rubbers will drive you mad, kicking the ball in a hellish wild manner all around the table. Keep your hand away from those "tensors". Prudence is the best part of a learned table tennis player, of which we strongly believe.

YRPSd0IYtYA.jpg
 
Top