USTTA rating v.s. expected win-rate

says Looking for a bat that makes me faster
Active Member
Jan 2023
717
699
2,149
I have done some calculations to help translating ratings v.s. skill levels. My calculations are done based on data from https://www.teamusa.org/USA-Table-Tennis/Ratings/Rating-System

When two players play together, the winner will gain the exact amount of points that the loser will lose. The amount of point exchanged depends on the difference of the ratings. Let X be the point exchanged when the higher-rated player wins and Y be the point exchanged when the lower-rated player wins.

Imagine two players with perfectly accurate ratings play against each other over infinite number of matches. Their ratings should not change in the long run. Now let P be the probability of the higher-rated player to win. We now have

P*X=(1-P)*Y

Rearranging this equation gives

P = Y/(X+Y)

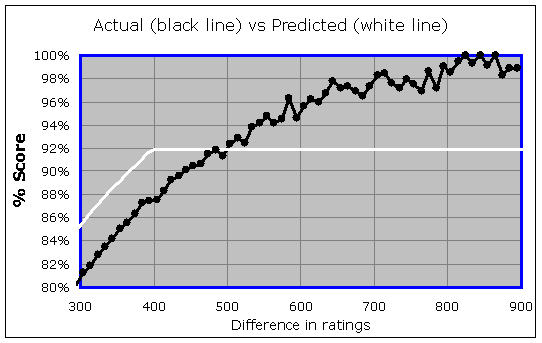
Now we can produce the following graph

USTTA.png


Markers are what the USTTA rules specify, the red dotted line is a fit with fixed points (P=0.5 if both players have the same rating, P=1 if the difference in rating is 238).

Some rule-of-thumb from this graph:

- if your opponent's rating is 50 points above yours, you are expected to win ~30% of the time.
- if your opponent's rating is 100 points above yours, you are expected to win ~20% of the time.
- if your opponent's rating is 150 points above yours, you are expected to win ~10% of the time.

I hope this makes it easier to understand the differences in level and the ratings. Let me know if there's any mistake :)

EDIT: Thanks to @brokenball, I have now realised that the fitted equation is only applicable if the difference in rating (x) is between 0 and 238. Let f(x) be the fitted equation on the graph above,

y = 1 if x >=238
y = f(x) if 238 > x >=0
y = 1-f(-x) if 0 > x >= -238
y = 0 if -238 > x

USTTA.png
 
Last edited:
This user has no status.
Well-Known Member
Jan 2019
1,119
721
2,225
Read 2 reviews
Bump
At least latej appreciated the work you did.
The graph looks good. Close enough. However..
The equation for y is wrong.
The reason should be obvious.
This always makes me giggle “reason should be obvious”. If someone made a mistake and posted their results with the mistake, it’s because it’s not obvious to them. 😂 Unless they intend to make the mistake in order to mislead people, but then there’s no point to point it out since they intended it to be wrong.
 
This user has no status.
Well-Known Member
Nov 2020
1,069
785
4,013
I have done some calculations to help translating ratings v.s. skill levels.
I hope this makes it easier to understand the differences in level and the ratings.

Thanks hclnnkhg. I like it. I understand the derivation of the expected win-rate from the USATT rules, but I don't understand the quoted sentences above. What do you mean by the words "skill levels" and "level" there? Do you mean real player's level? Please explain, how does it help you to understand it - the differences in level and the ratings.
 
This user has no status.
Well-Known Member
May 2011
1,189
1,261
3,111
This always makes me giggle “reason should be obvious”. If someone made a mistake and posted their results with the mistake, it’s because it’s not obvious to them. 😂 Unless they intend to make the mistake in order to mislead people, but then there’s no point to point it out since they intended it to be wrong.
I think it's obvious now that @brokenball is completely oblivious to how condescending he sounds. I think if he doesn't get it at his age, he's just never gonna get it.
 
  • Haha
Reactions: Tony's Table Tennis
This user has no status.
Active Member
Mar 2022
645
310
1,421
Bump
At least latej appreciated the work you did.
The graph looks good. Close enough. However..
The equation for y is wrong.
The reason should be obvious.
sonas13.gif


Actually, there are tons of different graphs and interpretations possible
 
  • Like
Reactions: latej
This user has no status.
Well-Known Member
Jul 2017
1,772
851
2,940
sonas13.gif


Actually, there are tons of different graphs and interpretations possible
Your graph doesn't make sense.
The graph in the link you posted does. It better because these guys are "experts".
 
  • Like
Reactions: OldUser
This user has no status.
Active Member
Mar 2022
645
310
1,421
The graph I've shown is actually in the same article in the link I've posted, my purpose was to show that there are always many interpretations possible, according to the algorithm you choose. But my hidden purpose was of course to show that USATT rating is nothing less than the chess ELO rating system, with a little twist of course. Since Bobby Fisher americans go crazy with the ELO system ...
 
says Looking for a bat that makes me faster
Active Member
Jan 2023
717
699
2,149
Thanks hclnnkhg. I like it. I understand the derivation of the expected win-rate from the USATT rules, but I don't understand the quoted sentences above. What do you mean by the words "skill levels" and "level" there? Do you mean real player's level? Please explain, how does it help you to understand it - the differences in level and the ratings.
My phrasing is misleading. There's only one level, which is your ability to win the match.
 
This user has no status.
Well-Known Member
Jul 2017
1,772
851
2,940
The graph I've shown is actually in the same article in the link I've posted, my purpose was to show that there are always many interpretations possible, according to the algorithm you choose.
The first graph with the picture doesn't make sense. Later we find it out is a graph of the predicted vs actual. The predicted line is not good.
The second graph, the one labeled "Theoretical Relationship:" makes sense.

The next graph titled "Ratings difference vs %Score(predicted) does not. A ratings difference of 900 points should not mean the stronger player wins only 92% of the time. This is non-sense.

The graph titled "Ratings difference vs %Score (actual) is real data that must have been gathered from many tournaments. I wonder which tournaments match players with a 900 point difference.

But my hidden purpose was of course to show that USATT rating is nothing less than the chess ELO rating system, with a little twist of course. Since Bobby Fisher americans go crazy with the ELO system ...
Yes, the USATT table is derived from the ELO system but the graph you showed doesn't make sense. The predicted data does not match the actual data at all. A real expert would be able to do this.
Actually, I bet if the theoretical and actual data were overlaid, they would match very closely.
I have no idea why they wanted that lame "predicted" graph.

This still doesn't address the problem with hcInnkhg's equation. This was taught in high school algebra. There are lots of videos and websites that cover this topic. That is why it should be obvious! Don't be so woke and butt hurt if you don't remember your high school algebra! I am 69 and I remember.

About ELO, I even remembered his first name
ELO is good but I like David Marcus's Ratings Central better.
 
This user has no status.
Well-Known Member
Nov 2020
1,069
785
4,013
My phrasing is misleading. There's only one level, which is your ability to win the match.

What you did was great. I was just at the moment really completely dim to come up with ideas how you want to relate the level and the ratings/rules. For me the ratings do reflect the level. And OldUser gave me that way - compare the expected win-rate with the real win-rate. The real win-rate is probably the closest thing we can have to reflect the level. Thank you both.
 
This user has no status.
Well-Known Member
Jul 2017
1,772
851
2,940
What you did was great. I was just at the moment really completely dim to come up with ideas how you want to relate the level and the ratings/rules. For me the ratings do reflect the level. And OldUser gave me that way - compare the expected win-rate with the real win-rate. The real win-rate is probably the closest thing we can have to reflect the level. Thank you both.
But hcInnkng's equation is still wrong.
So is the graph for the predicted percentages in OldUsers' link.
 
says Looking for a bat that makes me faster
Active Member
Jan 2023
717
699
2,149
But hcInnkng's equation is still wrong.
So is the graph for the predicted percentages in OldUsers' link.
I'm afraid I'm not bright enough to figure out what's wrong with the equation by myself, could you enlighten me please? I plug the numbers in the equation in Excel and it gives me what I expected.
 
  • Like
Reactions: NextLevel
This user has no status.
Well-Known Member
Jul 2017
1,772
851
2,940
I'm afraid I'm not bright enough to figure out what's wrong with the equation by myself,
Neither is anybody else. What is worse is that no one tried different rating differences. I thought that OldUser would figure it out since his graphs went up to a ratings difference well beyond 250.

could you enlighten me please? I plug the numbers in the equation in Excel and it gives me what I expected.
Sure, math class begins.
First, what is wrong.
Have you heard of even and odd polynomials? In algebra class did you ever need to plot them out? If you plotted out your function beyond the range 0 to 250 you would see the problem.
Your equation is
The problem is the the -8.4E-6*x^2 is an even and looks like an upside down U with the peak at about 250. The percentages start to decrease. No one on the forum even bothered to try a ratings difference of 300, 400, 500 even though I hinted at it. The x^2 term should have been enough but then you should have tried numbers outside of the range from 0 to 250.
Look up odd and even functions. Khan academy has lessons on this topic.
Anyway, it is obvious that the -x^2 term would be a problem.

The correct formula is not a simple polynomial. It is sigmoid function. The theoretical percent vs ratings difference in OldUser's link is a sigmoid function. Notice that when the ratings difference is positive, the curve looks much like yours but the percentage will approach 1 as the rating difference increases, unlike your equation. A sigmoid function will also handle the case where the ratings difference is negative so the probabilities for the weaker player winning is less than 0.5. Your equation doesn't work when the ratings difference is negative.


Now use the sigmoid function as your equation. It should be in the form of y=1/(1+exp(-k*x)). k determines how rapidly the sigmoid function reaches +/- 1 and the slope at a 0 ratings difference.
Note, a tanh() function will also yield a sigmoid.

Sigmoid functions are using in other ratings systems like rating central and in neural nets, anywhere where a number must be converted to a range of percentage from 0 to 1. I have used them for motion control. One more thing. In this application a ratings difference of 0 means the probability for winning is 0.5. Another application a x might need to be offset to get a probability of 0.5. In this case, offset x like this y=1/(1+exp(-K(x-b)) where b is the offset. Your curve fitting code should include an offset if trying to fit the sigmoid to raw data.

Your curve fitting is good but you can't assume a simple polynomial will match the data. Now apply your curve fitting program to ratings difference from -500 to +500 and plot it.

I have doubts about the so called "experts" in OldUser's link. The predicted graph doesn't match the actual data at all.
 
  • Like
Reactions: hclnnkhg
says Looking for a bat that makes me faster
Active Member
Jan 2023
717
699
2,149
Neither is anybody else. What is worse is that no one tried different rating differences. I thought that OldUser would figure it out since his graphs went up to a ratings difference well beyond 250.


Sure, math class begins.
First, what is wrong.
Have you heard of even and odd polynomials? In algebra class did you ever need to plot them out? If you plotted out your function beyond the range 0 to 250 you would see the problem.
Your equation is
The problem is the the -8.4E-6*x^2 is an even and looks like an upside down U with the peak at about 250. The percentages start to decrease. No one on the forum even bothered to try a ratings difference of 300, 400, 500 even though I hinted at it. The x^2 term should have been enough but then you should have tried numbers outside of the range from 0 to 250.
Look up odd and even functions. Khan academy has lessons on this topic.
Anyway, it is obvious that the -x^2 term would be a problem.

The correct formula is not a simple polynomial. It is sigmoid function. The theoretical percent vs ratings difference in OldUser's link is a sigmoid function. Notice that when the ratings difference is positive, the curve looks much like yours but the percentage will approach 1 as the rating difference increases, unlike your equation. A sigmoid function will also handle the case where the ratings difference is negative so the probabilities for the weaker player winning is less than 0.5. Your equation doesn't work when the ratings difference is negative.


Now use the sigmoid function as your equation. It should be in the form of y=1/(1+exp(-k*x)). k determines how rapidly the sigmoid function reaches +/- 1 and the slope at a 0 ratings difference.
Note, a tanh() function will also yield a sigmoid.

Sigmoid functions are using in other ratings systems like rating central and in neural nets, anywhere where a number must be converted to a range of percentage from 0 to 1. I have used them for motion control. One more thing. In this application a ratings difference of 0 means the probability for winning is 0.5. Another application a x might need to be offset to get a probability of 0.5. In this case, offset x like this y=1/(1+exp(-K(x-b)) where b is the offset. Your curve fitting code should include an offset if trying to fit the sigmoid to raw data.

Your curve fitting is good but you can't assume a simple polynomial will match the data. Now apply your curve fitting program to ratings difference from -500 to +500 and plot it.

I have doubts about the so called "experts" in OldUser's link. The predicted graph doesn't match the actual data at all.
I see. I will modify my original post to specify the applicable range.
 
  • Like
Reactions: NextLevel
This user has no status.
Well-Known Member
Jan 2019
1,119
721
2,225
Read 2 reviews
Neither is anybody else. What is worse is that no one tried different rating differences. I thought that OldUser would figure it out since his graphs went up to a ratings difference well beyond 250.


Sure, math class begins.
First, what is wrong.
Have you heard of even and odd polynomials? In algebra class did you ever need to plot them out? If you plotted out your function beyond the range 0 to 250 you would see the problem.
Your equation is
The problem is the the -8.4E-6*x^2 is an even and looks like an upside down U with the peak at about 250. The percentages start to decrease. No one on the forum even bothered to try a ratings difference of 300, 400, 500 even though I hinted at it. The x^2 term should have been enough but then you should have tried numbers outside of the range from 0 to 250.
Look up odd and even functions. Khan academy has lessons on this topic.
Anyway, it is obvious that the -x^2 term would be a problem.

The correct formula is not a simple polynomial. It is sigmoid function. The theoretical percent vs ratings difference in OldUser's link is a sigmoid function. Notice that when the ratings difference is positive, the curve looks much like yours but the percentage will approach 1 as the rating difference increases, unlike your equation. A sigmoid function will also handle the case where the ratings difference is negative so the probabilities for the weaker player winning is less than 0.5. Your equation doesn't work when the ratings difference is negative.


Now use the sigmoid function as your equation. It should be in the form of y=1/(1+exp(-k*x)). k determines how rapidly the sigmoid function reaches +/- 1 and the slope at a 0 ratings difference.
Note, a tanh() function will also yield a sigmoid.

Sigmoid functions are using in other ratings systems like rating central and in neural nets, anywhere where a number must be converted to a range of percentage from 0 to 1. I have used them for motion control. One more thing. In this application a ratings difference of 0 means the probability for winning is 0.5. Another application a x might need to be offset to get a probability of 0.5. In this case, offset x like this y=1/(1+exp(-K(x-b)) where b is the offset. Your curve fitting code should include an offset if trying to fit the sigmoid to raw data.

Your curve fitting is good but you can't assume a simple polynomial will match the data. Now apply your curve fitting program to ratings difference from -500 to +500 and plot it.

I have doubts about the so called "experts" in OldUser's link. The predicted graph doesn't match the actual data at all.
Ahh, so you do know where it is wrong, I thought you were just bluffing. Why not just say it in your first poast, or do you just want others to "beg" you to make you look like you're better than other people, real nice.
 
This user has no status.
Well-Known Member
Jul 2017
1,772
851
2,940
Ahh, so you do know where it is wrong,
Yes, immediately! I knew what was wrong and how to do it right.. I have done all of this before.

I thought you were just bluffing.
Why? Don't you think that someone could actually know the answer?

Why not just say it in your first poast,
I could have but I wanted to see if someone else could see the problem.
All they had to do is try some ratings differences of 300 and more or mention that it was an even polynomial.
It really is high school algebra. I guess no one remembers it.

or do you just want others to "beg" you to make you look like you're better than other people
There is no "look" about this. Who else had a clue?

, real nice.
I was. Now hcInnkhg knows how to solve this problem and not to assume the final equation is a simple polynomial.
Learning at how to fit equations to data is used in many areas. I have made 3 YouTube videos about fitting equations to data. The last one was not a linear system.
 
This user has no status.
Well-Known Member
Jan 2019
1,119
721
2,225
Read 2 reviews
Yes, immediately! I knew what was wrong and how to do it right.. I have done all of this before.


Why? Don't you think that someone could actually know the answer?


I could have but I wanted to see if someone else could see the problem.
All they had to do is try some ratings differences of 300 and more or mention that it was an even polynomial.
It really is high school algebra. I guess no one remembers it.


There is no "look" about this. Who else had a clue?


I was. Now hcInnkhg knows how to solve this problem and not to assume the final equation is a simple polynomial.
Learning at how to fit equations to data is used in many areas. I have made 3 YouTube videos about fitting equations to data. The last one was not a linear system.
Yep, just shows what kind of a character you are. And also you didn’t read my first post of your first post. And also I didn’t bother to look at the calculations because I didn’t come on a tt forum to read about math, so I just don’t care if it’s wrong or not.
 
Top