USTTA rating v.s. expected win-rate

This user has no status.
Well-Known Member
Nov 2020
1,076
792
4,052
But hcInnkng's equation is still wrong.
So is the graph for the predicted percentages in OldUsers' link.

Yes. How can it be, that I truly honestly consider their posts as useful for me? How can that be, that regardless whether they are right or wrong in the things you point out, they really were useful for me?

Well, it is simply because we, you and I, focus on different things.
 
This user has no status.
Well-Known Member
Jul 2017
1,781
860
2,963
Yes. How can it be, that I truly honestly consider their posts as useful for me?
I don't know who you mean by "their".

How can that be, that regardless whether they are right or wrong in the things you point out, they really were useful for me?
How? You don't compute percentage of balls won, games won and matches won.

Well, it is simply because we, you and I, focus on different things.
I was able to point out two things.
I am now waiting for hcInnkng to show us a corrected percentage vs ratings difference graph and formula.

If hcInnkng figures this out he will have learned something significant that can pay much more than being a TT pro.
 
This user has no status.
Member
Apr 2022
187
85
340
Neither is anybody else. What is worse is that no one tried different rating differences. I thought that OldUser would figure it out since his graphs went up to a ratings difference well beyond 250.


Sure, math class begins.
First, what is wrong.
Have you heard of even and odd polynomials? In algebra class did you ever need to plot them out? If you plotted out your function beyond the range 0 to 250 you would see the problem.
Your equation is
The problem is the the -8.4E-6*x^2 is an even and looks like an upside down U with the peak at about 250. The percentages start to decrease. No one on the forum even bothered to try a ratings difference of 300, 400, 500 even though I hinted at it. The x^2 term should have been enough but then you should have tried numbers outside of the range from 0 to 250.
Look up odd and even functions. Khan academy has lessons on this topic.
Anyway, it is obvious that the -x^2 term would be a problem.

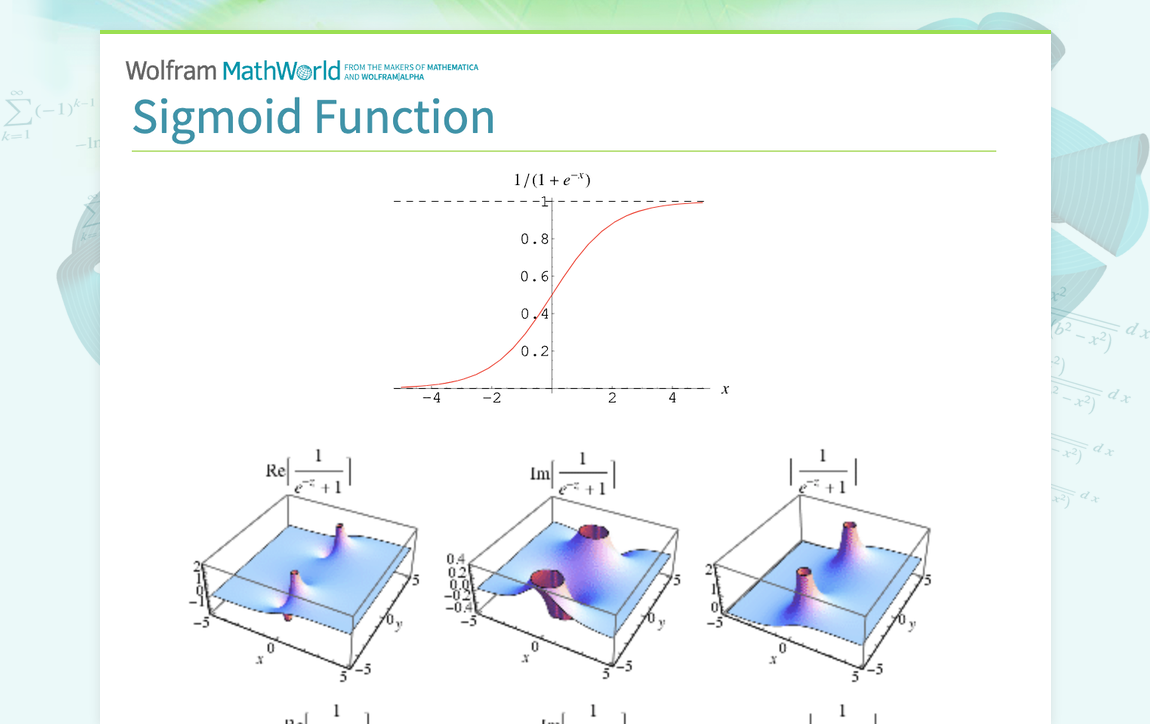
The correct formula is not a simple polynomial. It is sigmoid function. The theoretical percent vs ratings difference in OldUser's link is a sigmoid function. Notice that when the ratings difference is positive, the curve looks much like yours but the percentage will approach 1 as the rating difference increases, unlike your equation. A sigmoid function will also handle the case where the ratings difference is negative so the probabilities for the weaker player winning is less than 0.5. Your equation doesn't work when the ratings difference is negative.


Now use the sigmoid function as your equation. It should be in the form of y=1/(1+exp(-k*x)). k determines how rapidly the sigmoid function reaches +/- 1 and the slope at a 0 ratings difference.
Note, a tanh() function will also yield a sigmoid.

Sigmoid functions are using in other ratings systems like rating central and in neural nets, anywhere where a number must be converted to a range of percentage from 0 to 1. I have used them for motion control. One more thing. In this application a ratings difference of 0 means the probability for winning is 0.5. Another application a x might need to be offset to get a probability of 0.5. In this case, offset x like this y=1/(1+exp(-K(x-b)) where b is the offset. Your curve fitting code should include an offset if trying to fit the sigmoid to raw data.

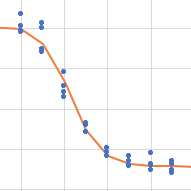
Your curve fitting is good but you can't assume a simple polynomial will match the data. Now apply your curve fitting program to ratings difference from -500 to +500 and plot it.

I have doubts about the so called "experts" in OldUser's link. The predicted graph doesn't match the actual data at all.
The quadratic regression was correct given the data and for that range, and does what it is supposed to do (give you an expected value for that range). Thus the confusion when you called it "wrong". But you are right, logistic regression is the proper regression to use here, as it accurately predicts beyond the range of supplied data, whereas the quadratic falls short of that task.

Perhaps you can give an extra hint to help us slow folks catch on to what you are saying next time. ;)
 
Last edited:
This user has no status.
Well-Known Member
Nov 2020
1,076
792
4,052
I don't know who you mean by "their".

Seriously??? So I write a post in which I thank to hclnnkhg and OldUser for "their" posts. You react to this very post, and say, they are wrong in this and that (which was btw. not necessary, because it was repeated). I force myself to reply to you, and say that "their" post was useful regardless. And you don't know whom I mean my "their"???

Please don't be surprised that this feels "futile" to me.

How? You don't compute percentage of balls won, games won and matches won.

I maintain, that you and I focus on different things.

If you excuse me, I have other things to do. As Igor says: Be happy.
 
  • Haha
Reactions: Tony's Table Tennis
This user has no status.
Active Member
Mar 2022
645
311
1,421
The first graph with the picture doesn't make sense. Later we find it out is a graph of the predicted vs actual. The predicted line is not good.
The second graph, the one labeled "Theoretical Relationship:" makes sense.

The next graph titled "Ratings difference vs %Score(predicted) does not. A ratings difference of 900 points should not mean the stronger player wins only 92% of the time. This is non-sense.

The graph titled "Ratings difference vs %Score (actual) is real data that must have been gathered from many tournaments. I wonder which tournaments match players with a 900 point difference.


Yes, the USATT table is derived from the ELO system but the graph you showed doesn't make sense. The predicted data does not match the actual data at all. A real expert would be able to do this.
Actually, I bet if the theoretical and actual data were overlaid, they would match very closely.
I have no idea why they wanted that lame "predicted" graph.

This still doesn't address the problem with hcInnkhg's equation. This was taught in high school algebra. There are lots of videos and websites that cover this topic. That is why it should be obvious! Don't be so woke and butt hurt if you don't remember your high school algebra! I am 69 and I remember.

About ELO, I even remembered his first name
ELO is good but I like David Marcus's Ratings Central better.
If you don't read the WHOLE ARTICLE written by Jeff Sonas, you won't get the point : it's always subjective, because it depends on what algorithm you choose to push your theory.
 
This user has no status.
Well-Known Member
Jul 2017
1,781
860
2,963
EDIT: Thanks to @brokenball, I have now realised that the fitted equation is only applicable if the difference in rating (x) is between 0 and 238. Let f(x) be the fitted equation on the graph above,

y = 1 if x >=238
y = f(x) if 238 > x >=0
y = 1-f(-x) if 0 > x >= -238
y = 0 if -238 > x

View attachment 24533
So what is f(x)? The reason I ask that y shouldn't be 1 if x>=238. Did you read OldUser's link?
You are not using a sigmoid function.
OldUser's article show the actual data looks like a sigmoid function.
All you need to find is the k value in f(x)=1/(1+exp(-k*x)) that minimize the sum of squared errors between the table and f(x) . I suspect you are using Excel. In this case you must use and Add-In

BTW, when not playing TT you should look up the functions that Excel uses to minimize the sum of squared errors between your equation and the data. Gradient descent is a good start.
 
This user has no status.
Well-Known Member
Jul 2017
1,781
860
2,963
If you don't read the WHOLE ARTICLE written by Jeff Sonas, you won't get the point : it's always subjective, because it depends on what algorithm you choose to push your theory.
What point? Fitting an equation to data isn't subjective. Yes, multiple forms of equations may need to be tried but one equation will result in minimizing the sum of squared errors. The goal is to have an equation that matches the data as closely as possible by minimizing the sum of squared errors between the data and the equation that that estimates the data.
 
says Looking for a bat that makes me faster
Active Member
Jan 2023
717
704
2,154
So what is f(x)? The reason I ask that y shouldn't be 1 if x>=238. Did you read OldUser's link?
You are not using a sigmoid function.
OldUser's article show the actual data looks like a sigmoid function.
All you need to find is the k value in f(x)=1/(1+exp(-k*x)) that minimize the sum of squared errors between the table and f(x) . I suspect you are using Excel. In this case you must use and Add-In

BTW, when not playing TT you should look up the functions that Excel uses to minimize the sum of squared errors between your equation and the data. Gradient descent is a good start.
f(x) is the original quadratic fit. I'm using a piecewise fit. y should be 1 if x >=238 because if when x>=238, the higher-rated player gains 0 rating point i.e. they are expected to win 100%. If this is wrong then you'd need to explain a bit more coz I don't get what you are getting at.
And no I haven't read OldUser's link.
 
  • Like
Reactions: NextLevel
This user has no status.
Well-Known Member
Nov 2020
1,076
792
4,052
What point? Fitting an equation to data isn't subjective. Yes, multiple forms of equations may need to be tried but one equation will result in minimizing the sum of squared errors. The goal is to have an equation that matches the data as closely as possible by minimizing the sum of squared errors between the data and the equation that that estimates the data.

No, it's not the goal at all. We have the USATT rules, and those rules imply the expected win-rate graph, in this case the blue "discrete" graph. And the goal is to have such rules, that the approximation of this implied "discrete" blue graph (expected win-rate), is as close match to the reality (real win-rate) as possible.

But as OldUser points out, the reality is already influenced by the current rules. Because what we call "reality" is the real win-rate for different differences in ELO, and this ELO (and thus the differences) was born from some rules (well, this rules) in the first place.

OldUser say's it is subjective... Or in another words, it is a bit recursive :- ) You ask what point? I say, we need a FIX-point. :- )

Forget all of this and just play TT!

And no I haven't read OldUser's link.

Me neither :- )
 
This user has no status.
Well-Known Member
Jul 2017
1,781
860
2,963
No, it's not the goal at all. We have the USATT rules, and those rules imply the expected win-rate graph, in this case the blue "discrete" graph. And the goal is to have such rules, that the approximation
I am trying to show hcInnkng how to fit a curve to the data correctly.
I don't care what you think. No one is helping hcInnkng.
hcInnkng has put some effort into this but I fear he is using Excel which is not the best tool for this.
Perhaps I should just PM him and let the thread be dead.

of this implied "discrete" blue graph (expected win-rate), is as close match to the reality (real win-rate) as possible.
How do you know? How do you measure that it is a close to reality as possible?

But as OldUser points out, the reality is already influenced by the current rules. Because what we call "reality" is the real win-rate for different differences in ELO, and this ELO (and thus the differences) was born from some rules (well, this rules) in the first place.
Reality is the actual win percentage vs ratings difference. We don't have the USATT data so what hcInnkng was trying to do is match an equation to the table but we really don't know how accurate the table is but it is all we have to go on.

OldUser say's it is subjective... Or in another words, it is a bit recursive :- ) You ask what point? I say, we need a FIX-point. :- )

Forget all of this and just play TT!


Me neither :- )
It is not subjective. There is a best fit with the minimum sum of squared errors.
OldUser's link is helpful because it shows what the actual data distribution looks like. The predicted data is bogus as it claims that a much stronger player will still win only 92% of the time.

Let this thread be dead unless hcInnkng wants to update his equation and graph. None of you, except OldUser, have contributed to this thread.
 
This user has no status.
Well-Known Member
Nov 2020
1,076
792
4,052
:- ))))

You're a lost case.

But this is a community, actually an amazing community. And I'm in a good mood, because before couple of hours I realized zeio started writing again, and I had a good laugh reading Zwill's post (which I missed because I was busy), and I enjoyed ttarc's and Richie's and Dan's and other posts... and you, even though you love to tell others that and where they are wrong, are part of this community...

Edit: Slivovica may have played a role... Night.
 
Last edited:
This user has no status.
Well-Known Member
Jul 2017
1,781
860
2,963
even though you love to tell others that and where they are wrong.
Is that all you care about? No one is ever wrong?
But the original equation is wrong so stop your woke sniveling.
What gets me is that all I got was grief and none of you bothered to check if what I said was true. The only thing that matters to you is to complain about me, not if I am right or not.
I at least I am telling hcInnkng how to do it right which is more than any of you are doing.
Anyone that is going to put that kind of effort into curve fitting does it out of curiosity and a desire to learn something new. The USATT rating table just happened to be what peaked his curiosity.
I have already PMed a link to hcInnkng showing how I did it right using a sigmoid. Also, the original quadratic equation fails past a ratings difference of 250 whereas the sigmoid does not. The original equation would fail if used over the range of the data in Olduser's link. There is only one right answer yet you continue to make excuses. Yes, hcInnkng's orginal graph looks good. I said it was close but...

I said, this this thread be dead unless hcInnkng wants to upgrade his graph.
 
This user has no status.
Well-Known Member
Jan 2019
1,119
723
2,225
Read 2 reviews
Blah blah blah blah blah….

@latej brokenball is not a lost case, he/she/they/it is broken as the name suggests. Also he/she/they/it can’t realize that he/she/they/it can be wrong some times, and by wrong I mean he/she/they/it doesn’t have common sense. Like I said in the first post here, if someone posted their findings with an error, that means the error isn’t obvious to said person. So by saying “it’s obviously wrong” without saying what exactly is wrong, is being wrong and rude.
 
says Shoo...nothing to see here. - zeio
Well-Known Member
Jan 2018
7,492
9,490
18,774
ECalj1A.jpg

.
.
.
.
.
.
.
.
.
.
.
.
.
.
stupid people: 87
he/she/they/it: L8
 
  • Like
Reactions: latej
says Shoo...nothing to see here. - zeio
Well-Known Member
Jan 2018
7,492
9,490
18,774
:- ))))

You're a lost case.

But this is a community, actually an amazing community. And I'm in a good mood, because before couple of hours I realized zeio started writing again, and I had a good laugh reading Zwill's post (which I missed because I was busy), and I enjoyed ttarc's and Richie's and Dan's and other posts... and you, even though you love to tell others that and where they are wrong, are part of this community...

Edit: Slivovica may have played a role... Night.
Glad to be able to lighten up your mood (until I get banned again). At this rate, it won't be long before I go dark again.

There's no use avoiding. The thing is he will rub everyone up the wrong way, always. I'll keep engaging him when I feel like it. It's exciting.
 
This user has no status.
Well-Known Member
Jul 2017
1,781
860
2,963
Like I said in the first post here, if someone posted their findings with an error, that means the error isn’t obvious to said person.
So is that my problem?

So by saying “it’s obviously wrong” without saying what exactly is wrong, is being wrong and rude.
Rude? It was a clue that hcInnkngs equations should be verified. No one did. Is that my problem?
It just means that you really didn't care whether the equation is wrong or right. You only want to snivel
I did say what was wrong with the hcInnkng's equation and I have provided hcInnkng a link to how I fit a sigmoid to the data. You have done nothing but snivel.
I find it amazing that you will listen to all the opinions on this forum and if someone has a different opinion that yours, it is no big deal. No one ever provides proof of why their opinion that is different from yours. However you think I need to provide proof right away. Like latej all want to do is snivel because I said it is obvious. It is obvious to me anyway. Would it be better if I was all wishy washy and said, in my opinion the equation is obviously wrong? Then I wouldn't need to back up my opinion?
 
This user has no status.
Well-Known Member
Jan 2019
1,119
723
2,225
Read 2 reviews
So is that my problem?


Rude? It was a clue that hcInnkngs equations should be verified. No one did. Is that my problem?
It just means that you really didn't care whether the equation is wrong or right. You only want to snivel
I did say what was wrong with the hcInnkng's equation and I have provided hcInnkng a link to how I fit a sigmoid to the data. You have done nothing but snivel.
I find it amazing that you will listen to all the opinions on this forum and if someone has a different opinion that yours, it is no big deal. No one ever provides proof of why their opinion that is different from yours. However you think I need to provide proof right away. Like latej all want to do is snivel because I said it is obvious. It is obvious to me anyway. Would it be better if I was all wishy washy and said, in my opinion the equation is obviously wrong? Then I wouldn't need to back up my opinion?
Yep, that’s your problem because you have no common sense of what is being a decent human being. But if you’re what you say you are, a broken ball, then you are not wrong. And yes, obvious to you, only, and if you don’t say what it is then it’ll still be you, only. So who’s the problem here?

Let’s play my favorite game, bring it to the extreme. Earth is about to blow up because some fusion reactor is acting weird , brokenball walks by and says to the guys trying to fix it “it’s obvious what’s wrong isn’t it?” Then left the scene without another peep. A few days later earth becomes a broken ball. Who’s fault is that?
 
  • Haha
Reactions: NextLevel
says Shoo...nothing to see here. - zeio
Well-Known Member
Jan 2018
7,492
9,490
18,774
Let me play mod here.

DukeGaGa, avoid brokenball.
brokenball, avoid DukeGaga.

Or else I'll swing the ban hammer on you.

3-week ban for DukeGaGa since I feel like you are the instigator.
1-week ban for brokenball since you're just being you.

Another interesting thread going down the drain.
 
This user has no status.
Well-Known Member
Jan 2019
1,119
723
2,225
Read 2 reviews
Let me play mod here.

DukeGaGa, avoid brokenball.
brokenball, avoid DukeGaga.

Or else I'll swing the ban hammer on you.

3-week ban for DukeGaGa since I feel like you are the instigator.
1-week ban for brokenball since you're just being you.

Another interesting thread going down the drain.
Sure, I’m the instigator, but I believe everyone else knows what happened and who’s to blame. At times, someone has to speak up.
 
says Shoo...nothing to see here. - zeio
Well-Known Member
Jan 2018
7,492
9,490
18,774
Okay, 2-week ban for DukeGaGa since you didn't mention "it's exciting" but you still get an extra week of ban for saying "someone has to speak up".
 
Top