Thanks for being constructive, songdavid98. The default approach when dealing with binomial distributions is to compare the value (52.6%) to the theoretical one (in our case 50%) and not to 1-p (47.4%). At least that's what someone does, if they were to test the hypothesis that the game is fair (i.e. we're expecting 50%). Thus, table tennis is not 5-6% off, it's 2.6% off in men's game and 3.3% in women's. It would be appropriate to compare the percentages if we were comparing
two different distributions, e.g. table tennis vs tennis.
Another way to look at these numbers would be to evaluate their impact in actual games, which I did when arguing with Der_Echte's idea:
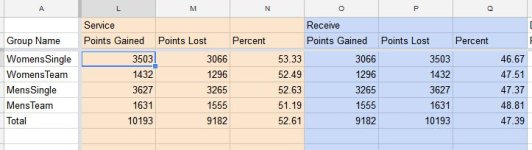
During Rio Olympics Men's Singles event servers won 52.6% of the points, i.e. a measly 1 point advantage per 3 games worth of serves
1 point in 3 games worth of serves (and that's being generous and assuming each game has 11 serves) comes from the fact that 33*.526 - 33*.5 = 1 approximately. I.e. if I were to serve 33 times and was expected to convert 52.6% of those, the score would've been 17-16 in my favor (or, to be precise, 17.358 - 15.642 but scores are integer-valued so I rounded them off). Everything else is your interpretation. I interpret this as a tiny advantage.
Yet another way to help yourself make sense of the number is to compare the percentages with something that's already considered balanced and with good reason. Like chess. That I also did:
In fact, tha game of table tennis is far more balanced than chess, renowned for its fairness and long thought to be completely fair (draw if both play perfectly). Turns out, white win 10% more frequently.
To be fair if the game is played by chess engines (computers), which play way, way, wa-a-a-y better than any human, white "only" wins in 55% of non-drawn games.
We can also compare table tennis to something less balanced. Like tennis! There players routinely win 70-75% of their service points. Now
that is a game where serve is hugely impactful. So there you go
")